


Next: A note on Implementation
Up: Visualization of Automata
Previous: Postscript
Subsections
The option -tk [[-q Integer] [-xd Dist] [-angle Angle]] File
indicates that a finite state automaton is read from File and shown in
a Tk Widget. The -xd option can be used to alter the default X
distance of nodes (default: 120). The -angle option indicates
the angle of edges (default: 0.25). Straight lines can be obtained
with a value of 0.
The quality option indicates how hard the system
should try to obtain a good visualization. Default is 1, which
indicates that not much effort is made at reducing the number of
crossing branches; larger integers will (dramatically) increase
processing time, resulting sometimes in slightly better output.
The Tk Widget offers a graphical user interface to browse
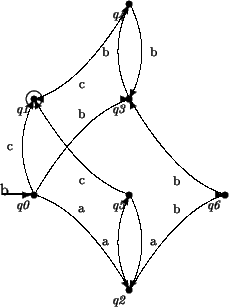
finite-state automata. For an illustration, consider figure 3.
The use of this widget is explained now as follows.
Figure 3:
The FSA Utilities toolbox uses Tcl/Tk for its
built-in visualization of finite-state automata. The user can
interactively alter the visualization by dragging
states of the automaton to different positions. LATEX
picture output and Postscript output can be generated on the basis
of the current view.
|
|
The canvas displays the finite-state automaton. The display can be
controlled by a number of options to the fsa command, or on-line
by using the button-bar.
By default, edges are not drawn as straight
lines, but as curves. The angle of the edge is determined by the
-angle option or the Edge Angle field on the button-bar.
The default distance between nodes is determined by the -xd
option or the X-distance field on the button-bar.
Finally the system provides limited functionality to compute the most
suitable geometry. The intent is to minimize the number of crossing
edges, as well as the size of the area needed to display an automaton.
Since in general such a procedure is much too costly, the -q
option or the Quality field on the button-bar can be used to tell
the system how much effort should be spent on this. A higher value
should imply better quality.
The finite-state automaton can be manipulated manually by dragging
states of the automaton to a new place. This possibility implies that
you can adapt the visualization of the automaton to your own taste, and
to the characteristics of a particular automaton.
- Save
- The current geometry of the finite-state automaton is
saved in the file from which the current automaton was read. Note that
the next time this file is used as input for the fsa -tk
command, all geometry options are ignored, and this information is
used instead.
- SaveAs
- As the above, but the user is prompted for a file-name.
- SaveAsTeX
- The user is prompted for a file-name. In this file
the system outputs the current geometry of the automaton as a LATEX
picture. This can then be used in a LATEX file, to give e.g.:
- SaveAsPs
- The user is prompted for a file-name. In this file
the system outputs the current geometry of the automaton as a Postscript
picture.
- Load
- You are prompted for a file-name. The file-name is assumed
to contain a finite-state automaton which will be displayed in the
canvas.
- Redraw
- The current automaton is redrawn.
- Revert
- All changes are discarded and the automaton is redrawn.
- Pause
- The Tk-Widget is removed from the screen.
- Debugging
- When this option is set, progress information during
the computation of the geometry is shown.
- Quit
- The application is halted.
- Edge Angle
- Determines the edge of an angle. When this is set to 0
then straight lines are used. Useful values are between 0 and 1.
- X-distance
- Determines the distance between nodes.
- Quality
- Determines the effort that should be spent on the
computation of the geometry. If this value is larger than 0, the
system tries to minimize the number of crossing edges and the size
of the area needed for the automaton. Larger values dramatically
increase the time needed to compute this.
- Help
- The man page is displayed in an xterm.
Next: A note on Implementation
Up: Visualization of Automata
Previous: Postscript
Noord G.J.M. van
1998-09-28
![\includegraphics[scale=0.65]{fps.ps}](img6.png)
![\includegraphics[scale=0.6]{fig3.fig2.ps}](img8.png)