the result is an Encapsulated PostScript image

the result is an Encapsulated PostScript image
A more useful application is to use this program in combination with the cluster program, that can translate global structure to local differences.
If the difference matrix file also contains negative values, the result will be a two-way split, shades of blue for negative values, shades of red for positive values.
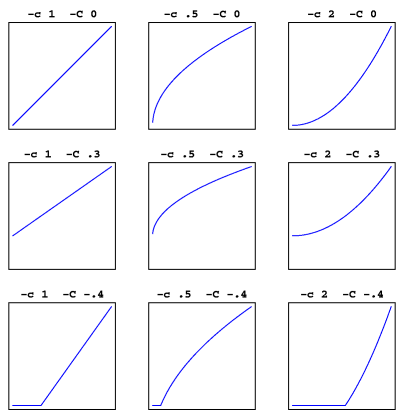
The value of EXP is set by the option -c (lower case).
The value of BASE is set by the option -C (upper case).
The resulting values fall in the range from 0 (or less, no visible lines) to 1 (darkest lines).
The graphs below show the effect of different values for both parameters. Top left is the default. Negative results are set to 0 (see bottom row graphs).

    cluster -wm -b -m 2-16 difference_file > tmp_file
    mapdiff config_file tmp_file > map.ps
Create a fuzzy cluster map, using Weighted Average:
    cluster -wa -b -m 6 -r 50 -N 1 difference_file > tmp_file
    mapdiff config_file tmp_file > map.ps
Create a cophenetic map, using Ward's Method. The factor .3333 for parameter -c corrects for the bias of Ward's Method. The value -.3 for parameter -C shifts the values a bit so the full range from light to dark lines is available:
    cluster -wm -c ftr.dif > tmp_file
    mapdiff -c .3333 -C -.3 config_file tmp_file > map.ps
The program cluster can process only one difference table file, and use only one cluster method on that file. But you can use the program difsum to combine multiple clusterings. Here is an example:
    cluster -ga -b -m 12 -r 50 -N 1 difference_file > tmp_file1
    cluster -wa -b -m  6 -r 50 -N 1 difference_file > tmp_file2
    difsum tmp_file1 tmp_file2 > tmp_file
    mapdiff config_file tmp_file > map.ps