3. Example: Pennsylvania, lexical distances
In this part of the tutorial, we continue with the data from Pennsylvania.
You downloaded the required files in
part 2.
In the previous part of the tutorial, we determined dialect areas bases on
pronunciation by comparing sequences of phonetic symbols. Now we
determine dialect areas based on choice of words.
If you look at phonetic differences, you can make a very detailed comparison.
There are numerous possibilities for variation in pronunciation of a
single word. Words can differ only slightly, in a single sound, or
differ very much. If you look at choice of words, there is much less
variation. Sometimes, there are only two variant forms. In the eastern
area one word is used to name a specific bird, in the western part another
word is used. Because of this, determining dialect areas based on
lexical comparison is less precise than based on phonetic comparison.
But you do have more choice among methods to determine the lexical
differences.
3.1 Three methods
We will measure lexical difference in Pennsylvania using three different methods.
- 1. Levenshtein distance
- This is the same method as was used for determining phonetic differences.
De differences between two character sequences is determined by the
number of characters that differ between the two sequences.
It seems a bit odd to use this method here, because you are not comparing
individual sounds within words, but complete words. But you are not
only dealing with choice of words ("tree" versus
"bush"), but also with differences in derivation of words
("tree" versus "trees"). In the first case, the
difference is larger than in the second case. (Length of words has
little effect, because the leven program
normalises for word length.)
- 2. Binary difference
- This method only looks whether two words are identical or not.
- 3. Gewichteter Identitätswert (G.I.W.)
- This method also looks only whether two words are identical or not,
irrespective of how much two words differ. But this method also looks
at how many times a particular word form occurs.
Suppose, you have a set of words A, which contains among other
variants the variant forms A' and A''. The differences are
determined as follows:
| Levenshtein | binary | G.I.W.
|
|---|
| difference A' and A' | 0 | 0 | n' / n
|
| difference A' and A'' | Levenshtein(A', A'') | 1 | 1
|
Which has:
- Levenshtein(A', A'') :
- the Levenshtein distance, the least-cost way to change one sequence of
tokens into the other
- n' :
- the total count of variant A'
- n :
- the total number of words (not just variants) in group A
Note that you can't use the binary method or G.I.W. for determining phonetic
distances. Both methods assume there is a sufficient number of identical forms in
the data.
3.2 Lexical distances
We determine the lexical differences in three ways. To determine the binary
differences, you can use the same program as for determining the
Levenshtein distances, by using the command line option
-B.
To determine the Gewichteter Identitätswert, you use the
giw program:
    leven -n 67 -l PA.lbl -o lex-lev.dif lex/*.lex
    leven -B -n 67 -l PA.lbl -o lex-bin.dif lex/*.lex
    giw -n 67 -l PA.lbl -o lex-giw.dif lex/*.lex
You now have three tables with lexical differences. Using these, you can make
three cluster maps, like you did in
part 2 with phonetic differences:
    cluster -wm -o lex-lev.clu lex-lev.dif
    cluster -wm -o lex-bin.clu lex-bin.dif
    cluster -wm -o lex-giw.clu lex-giw.dif
    mapclust -o map-lev.ps PA.cfg lex-lev.clu 4
    mapclust -o map-bin.ps PA.cfg lex-bin.clu 4
    mapclust -o map-giw.ps PA.cfg lex-giw.clu 4
You will see that these three maps are not identical. So, which map is the most
accurate? That question will be addressed in part 6
of the tutorial.
3.3 Multidimensional scaling
Multidimensional scaling (MDS)
is a technique that, using a table of differences, tries to position a set of
elements into some space, such that the relative distances in that space
between all elements corresponds as close as possible to those
in the table of differences. You can apply MDS on the plane (two
dimensions), in three-dimensional space, or with another number of dimensions.
There is a nice trick you can do with MDS. First you apply MDS in three
dimensions, so each place is assigned three coordinates. You can do
this with the mds program.
The program offers several methods. Kruskal's Method
(option: -K) usually gives the best results.
Then you use the three coordinates as colour components (red, green, and blue)
to give each place a unique composite colour. This is done with the
maprgb program. Below is an example based
on the phonetic differences from part 2.
Try making similar maps based on lexical differences.
    mds -K -o fon.vec 3 fon.dif
    maprgb -o map3.ps PA.cfg fon.vec
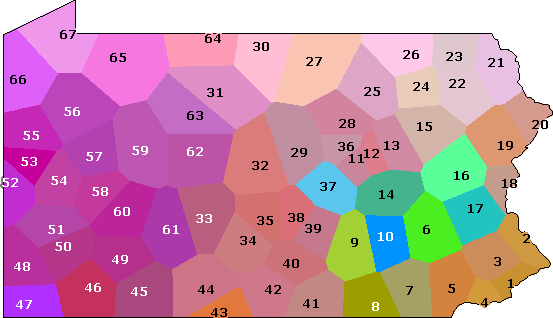
This is the map you get:

MDS map of phonetic differences
This map shows things that were not visible in the
cluster map.
At the left, you see an area were the colours are very similar (the cyan area
of the cluster map). This indicates that the differences within this area
are relatively small. At the right, you can see an area with strong
colour contrasts (the blue area of the cluster map). Within this area
differences are bigger.
Like the cluster map, the MDS maps has disadvantages and limitations. These are discussed
elsewhere.
If you want to import the output of the
mds program
into software not part of
RuG/L04, then you can
use the
vec2tab program to
translate the data into a format that is more current for most software.
3.4 MDS and clustering
In the remainder of this part of the tutorial, we use
mdsplot,
a program that is currently not available as a stand-alone C program, but only
as a Perl script. This means you need Perl to run it. If you use Windows,
you could download
ActivePerl.
Download the script:
mdsplot
On Unix: if necessary, change the first line of the script, so it points to the
right location of the Perl interpreter. Make the script executable.
On Windows: whenever below we use the command mdsplot, replace this with
perl mdsplot (and make sure
perl is in your PATH).
We continue with the phonetic differences from
part 2 of the tutorial, and compare them to the
lexical differences of this part.
3.4.1 Phonetic differences
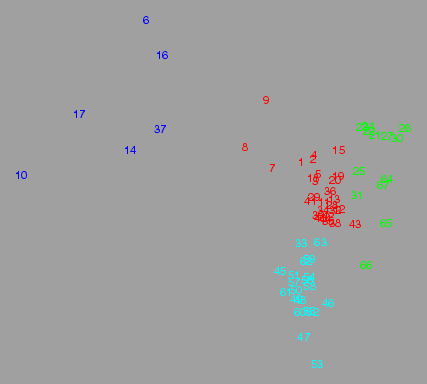
We apply MDS in two dimensions, and plot the results in a diagram, using the
colours that were assigned by clustering. For phonetic differences, the result
looks like this:

Phonetic differences
You can make a diagram like the one above with
mdsplot.
This program reads options from a configuration file. The next file has all the
options set to make the diagram above:
mdsplot.cfg
Download this file, and run the command:
mdsplot mdsplot.cfg
The result is shown above.
What does the diagram show? The blue cluster consists of only six places, but
they take up a large part of the space. This indicates that these six places
differ strongly from the other places, and because these six places are
spread widely apart, these places differ also largely among each other.
These type of diagrams are useful as a tool to test the quality of a
clustering, and can be helpful for choosing the most suitable clustering method.
This is discussed
elsewhere.
3.4.2 Phonetic differences, a subset
Let's remove the blue cluster, and look a bit closer at the remaining clusters.
We remove six places from the data, and apply MDS to the remaining
places. This goes as follows. Copy the file
mdsplot.cfg to
mdsplot2.cfg, and open the copy with a text editor. You have to make a
few changes. Change the name of the file where the result is stored:
outfile: mdsplot2.ps
Change how places will be displayed:
markers: clnums
Save the file, and run the following command:
mdsplot mdsplot2.cfg
Have a look at the result. You'll see that places are no longer presented with
there own number, but with a cluster number. You can see the blue
cluster has number 1. These means, you want to apply MDS to clusters
2, 3, and 4. Edit the copy again. Undo the changes to the way places are displayed:
markers: numbers
And indicate which groups you want to use:
plot: 2 3 4
Save the file, and run the following command again:
mdsplot mdsplot2.cfg
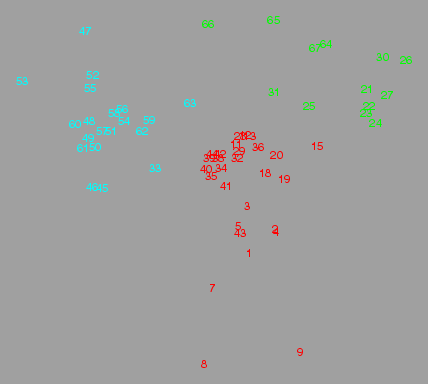
The result is shown below:

Phonetic differences, three out of four clusters
You can see that the three remaining groups are reasonable well separated from
each other, so they do indeed represent separate dialect areas.
3.4.3 Phonetic differences compared with lexical differences
Now we apply MDS to the lexical differences to see what happens to the clusters
we found with phonetic differences. To make this visible, we
give each place the same colour as with phonetic differences.
Copy the original configuration file mdsplot.cfg to
mdsplot3.cfg, and open the copy with a text editor. Change the name
of the file were results will be stored:
outfile: mdsplot3.ps
We use a table with lexical differences:
diffile: lex-lev.dif
We change the clustering method. Instead of clustering from within the program,
we read a clustering result from an external file:
    cluster: idx
    idxfile: fon.idx
Save the configuration file.
Make a group partitioning based on phonetic clustering, and save to file
(see manual page of clgroup):
clgroup -i -n 4 -o fon.idx fon.clu
And make a new diagram:
mdsplot mdsplot3.cfg
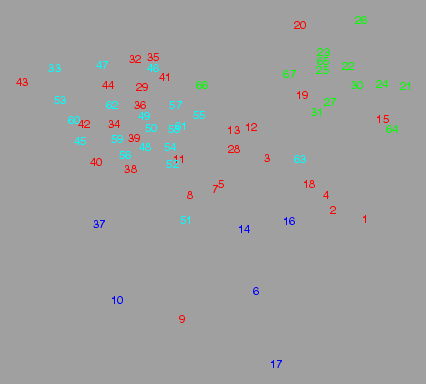
The result is shown below:

MDS of lexical differences, cluster colours of phonetic differences.
What is most remarkable in this diagram is that red and cyan places are mixed.
With phonetic measurements, we found a distinction between two dialect
areas, that is not visible from measurements based on lexical differences.


