Assignment 4
An organisation chart should give an impression of the structure of departments within an institute. For the first part of this assignment we use the OSCE organisation chart. The enclosed link http://www.osce.org/publications/factsheets/osce_e.pdf provides you a chart and a short explanation of the organisation. Within the first four paragraphs you get an idea of the organisation. After having read this part carefully, try to find he departments mentioned in the chart. You will soon find out that not all different departments in the chart are explained. The complexity of the chart may well symbolise the complexity of d.. making, but a closer look suspects that there is another, clearer way to design this chart
Practical assignment 4.1
Make a new and more comprehensive organisation chart. Some specific information of departments, mentioned in the text, is hardly noticeable in the original chart. Enclose this in your new version.
A process of treatment involves making decisions, analyses, tests, evaluation, etc. which should finally result in a cure for a patient or maybe even completely cured patient. Such a process can be clarified in a so-called Flow chart. A flow chart consists of keywords and symbols which are organised in such a way, that the 'start' and 'finish' of the process are where they should be found: at the beginning and the end.
Flow charts
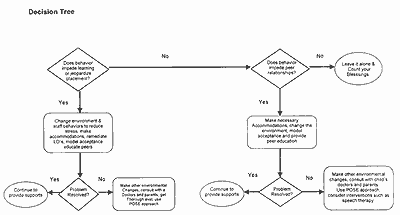
The Tourette syndrome is a complex disfunction in a person's brain, resulting in rather unpredictable behaviour, which makes communicating for the person involved very difficult. At the following link http://www.tourettesyndrome.net/Files/Miscellaneous/flowchart.pdf you find a flowchart at the third and fourth page. All four pages give information how to cope with the syndrome in a school situation. Probably the chart was originally designed for paper and not for screen display, since there is a split made; part one and part two.
This improved version of Y. Zomerman may look less fancy because it is in black and white. Other changes made seem to be little, but it is more effective as the original.
Practical assignment 4.2
For this assignment we take the process of designing a toy. The process of the design is given in a chart. Read the process carefully and improve the chart to a proper Flow Chart. (PVE=Product Vorm Eisen)

(Click to enlarge)
